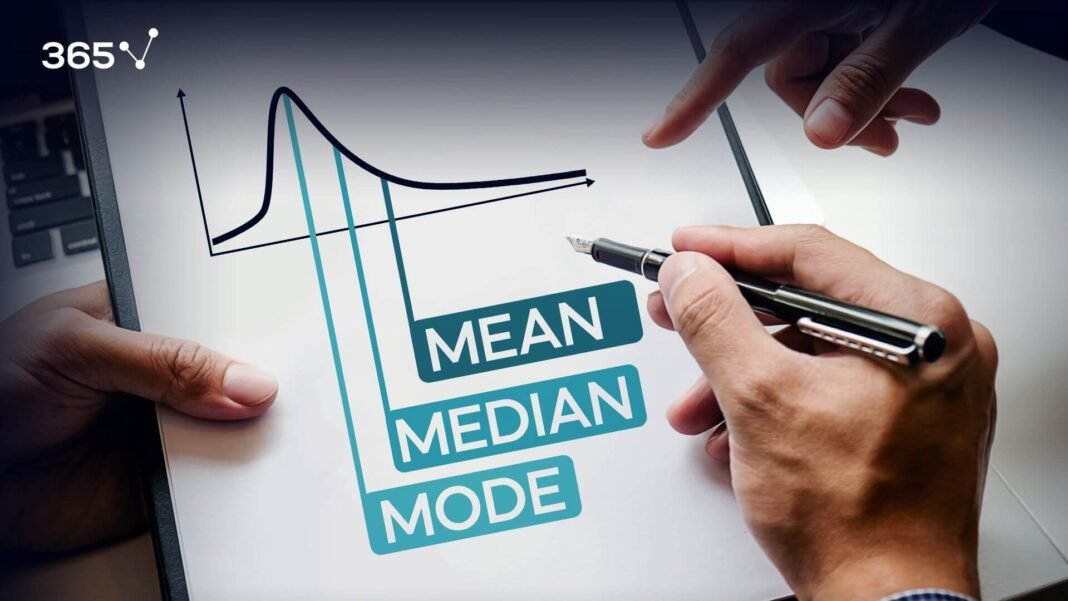
Median vs. Mean: When and Why to Use Each Measure
Introduction to Median and Mean
When analyzing data, choosing the right statistical measure can make all the difference. Two of the most common measures used are the median and the mean. But when should you use each, and why does it matter? Let’s dive deep into these two concepts to understand their applications, strengths, and limitations.
What Are Median and Mean?
Before we discuss the differences, let’s first define what each of these terms means.
Definition of Median
The median is the middle value of a data set when arranged in ascending or descending order. If the data set has an odd number of observations, the median is the middle number. For an even number of observations, it is the average of the two middle numbers.
Definition of Mean
The mean, often referred to as the average, is the sum of all values in a data set divided by the number of values. It’s a measure that represents the central tendency of a data set.
Importance of Understanding Median and Mean
Understanding the differences between the median and mean helps in choosing the right tool for analyzing and interpreting data effectively. This choice can influence how you draw conclusions from data, make decisions, and solve problems.
Deep Dive into Mean
What is the Mean?
The mean is a fundamental statistical measure used to find the average of a set of numbers. It is commonly used in various fields, from finance to science.
Calculating the Mean
To calculate the mean, simply add up all the numbers in your data set and divide by the total number of values. For example, the mean of 4, 6, 8, and 10 is:
Mean=(4+6+8+10)4=7\text{Mean} = \frac{(4 + 6 + 8 + 10)}{4} = 7
Different Types of Mean (Arithmetic, Geometric, Harmonic)
There are different types of means:
- Arithmetic Mean: The regular mean or average.
- Geometric Mean: Used when comparing different items with varying properties, like growth rates.
- Harmonic Mean: Useful in situations involving rates, like speed.
Advantages of Using Mean
- Easy to Calculate: It’s straightforward and simple.
- Uses All Data Points: Every value in the data set is considered, giving a comprehensive overview.
- Best for Symmetrical Distributions: Ideal for evenly distributed data without outliers.
Disadvantages of Using Mean
- Sensitive to Outliers: Extreme values can distort the mean.
- Not Ideal for Skewed Data: It can misrepresent the data set if the distribution is not symmetrical.
Exploring the Median
What is the Median?
The median is the middle point of a data set, providing a better sense of the “center” when there are outliers.
Calculating the Median
To find the median:
- Arrange the data in numerical order.
- Identify the middle value (or the average of the two middle values if the data set has an even number of entries).
For example, in the data set 3, 5, 7, 9, and 15, the median is 7.
Median in Different Data Sets
The median remains the same even if outliers are present, making it useful in skewed data sets or those with anomalies.
Advantages of Using Median
- Not Affected by Outliers: It provides a more accurate measure of central tendency when outliers are present.
- Represents the Middle Point: It effectively shows the “middle” in a skewed data set.
Disadvantages of Using Median
- Ignores Extreme Values: It does not consider the magnitude of the outliers.
- Less Informative with Small Data Sets: In smaller data sets, it may not give a complete picture.
Mean vs. Median: Key Differences
Sensitivity to Outliers
The mean is highly sensitive to outliers, while the median is resistant to them. In data sets with extreme values, the median is often the better choice.
Data Distribution and Its Impact
The mean is most appropriate for symmetrical distributions, while the median works better for skewed data sets.
Applicability in Different Scenarios
Choosing between the mean and median depends on the nature of the data and the goal of the analysis.
When to Use the Mean?
Situations Favorable for Mean
Consistent Data Sets
When the data set is consistent without extreme values, the mean provides an accurate measure of central tendency.
Symmetrical Distributions
In a normally distributed data set, the mean reflects the “typical” value effectively.
When to Use the Median?
Situations Favorable for Median
Skewed Data Sets
For skewed data, the median is a better representation of the central point.
Presence of Outliers
When outliers or extreme values are present, the median provides a more accurate central tendency.
Real-World Examples of Using Mean and Median
Mean in Financial Analysis
The mean is commonly used to calculate average returns, helping investors make decisions.
Median in Real Estate Pricing
Real estate professionals often use the median to determine the “typical” home price in an area, avoiding distortions from extremely high or low values.
Common Misconceptions about Mean and Median
Misconception 1: Mean is Always Better
People often assume the mean is superior, but it is not always the best choice, especially with skewed data.
Misconception 2: Median Ignores Most Data
While it does not consider every value, the median provides valuable insight into the middle point of a data set.
How to Choose Between Mean and Median?
Analyze Your Data Set
Understand the distribution and look for outliers before deciding which measure to use.
Consider Your Goals
Think about what you aim to achieve with your data analysis, whether to understand the average or the central point.
Conclusion
Both the median and the mean are valuable statistical tools, each serving different purposes based on the nature of the data set and the goal of the analysis. The key is to understand their differences and apply them accordingly to get the most accurate results.


